Software:
Lightcurve Analysis Tool for Transiting Exoplanets (LATTE)
Your one-stop-shop for open-source software to analyze signals in TESS data.
Program overview
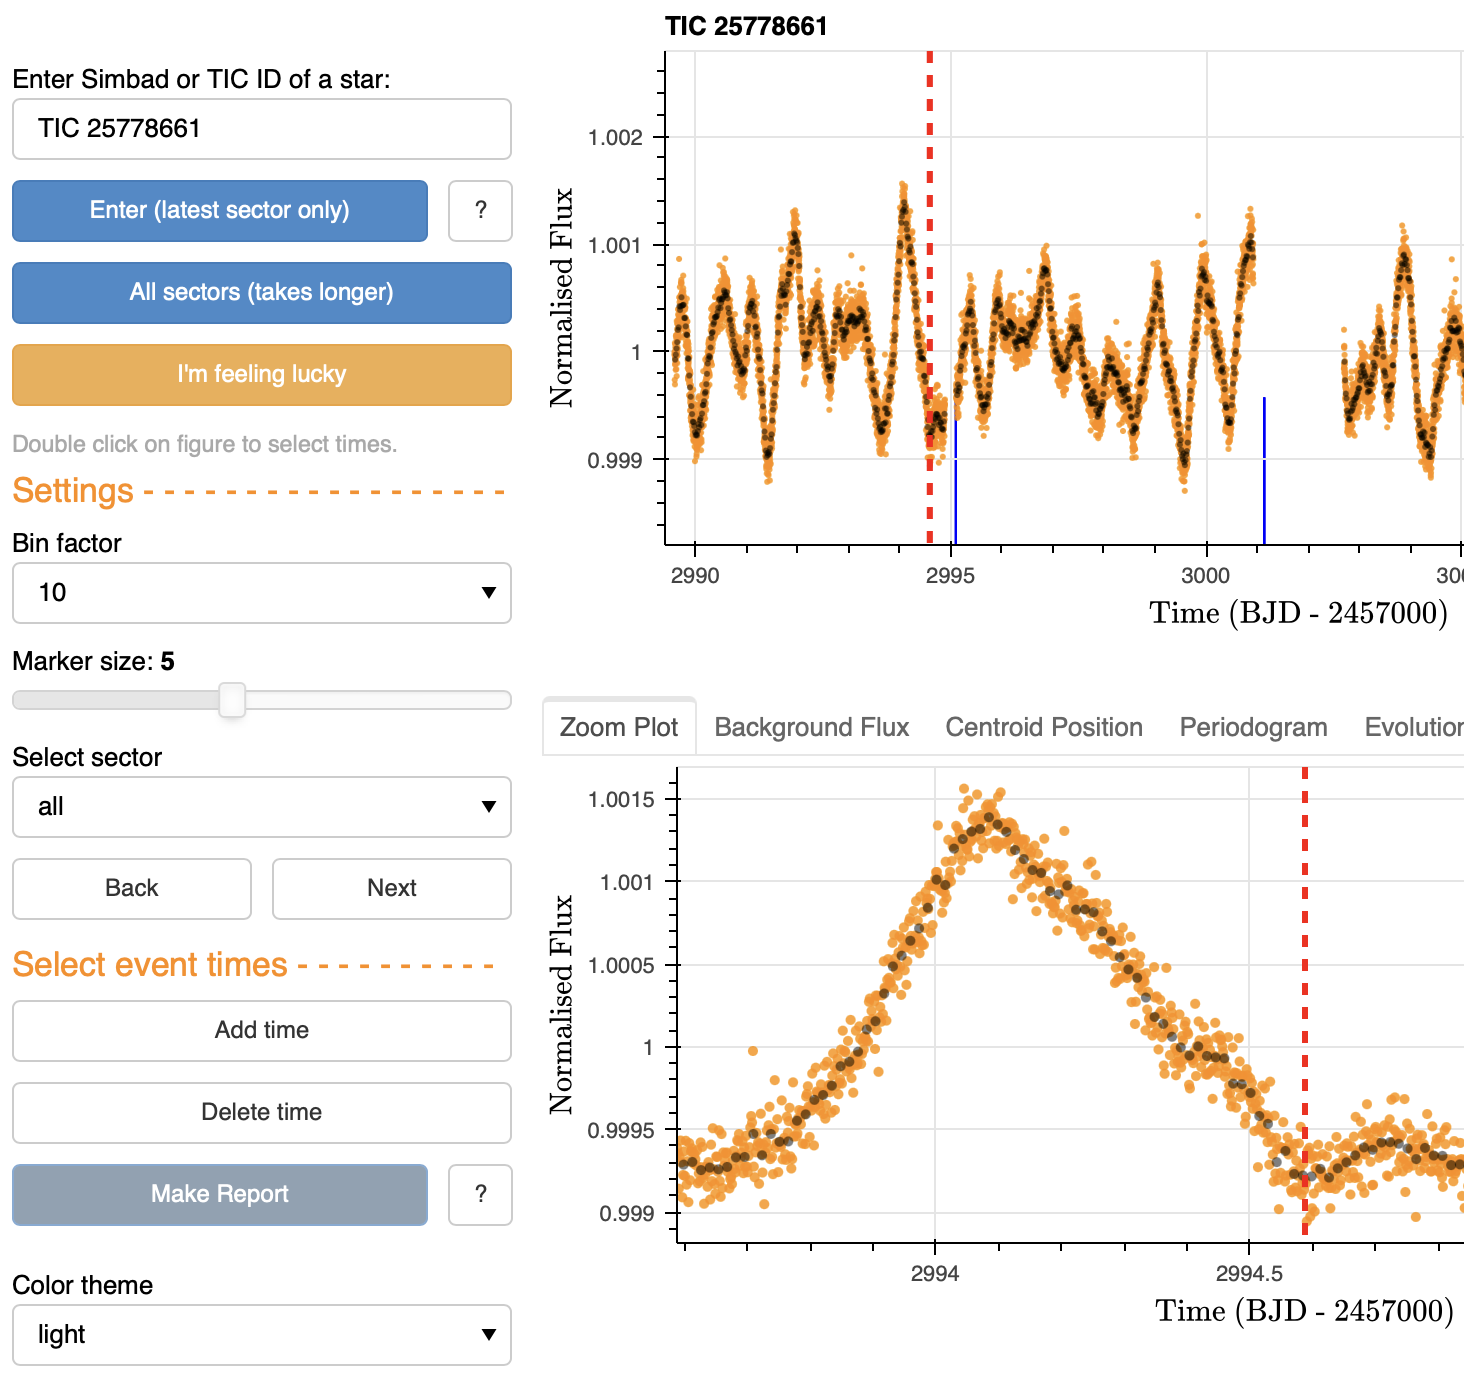
I designed and built a suit of software tools designed to look at signals in the TESS time series data in order to help determine their origin. This tool is called the Lightcurve analysis tool for transiting exoplanets, or LATTE for short, and was built using Python.
LATTE can be used to perform standard diagnostic tests that help differentiate between real exoplanet or stellar signals and false positive scenarios (such as asteroids). The tests include, but are not limited to, ensuring that:
The transit events do not coincide with the times of the periodic momentum dumps that introduce spurious signals into the data.
The x and y centroid positions are smoothly varying with time in the vicinity of the transit events and are thus unlikely to be caused by systematic effects.
The light curves of the five nearest stars do not show similar signals at the same time.
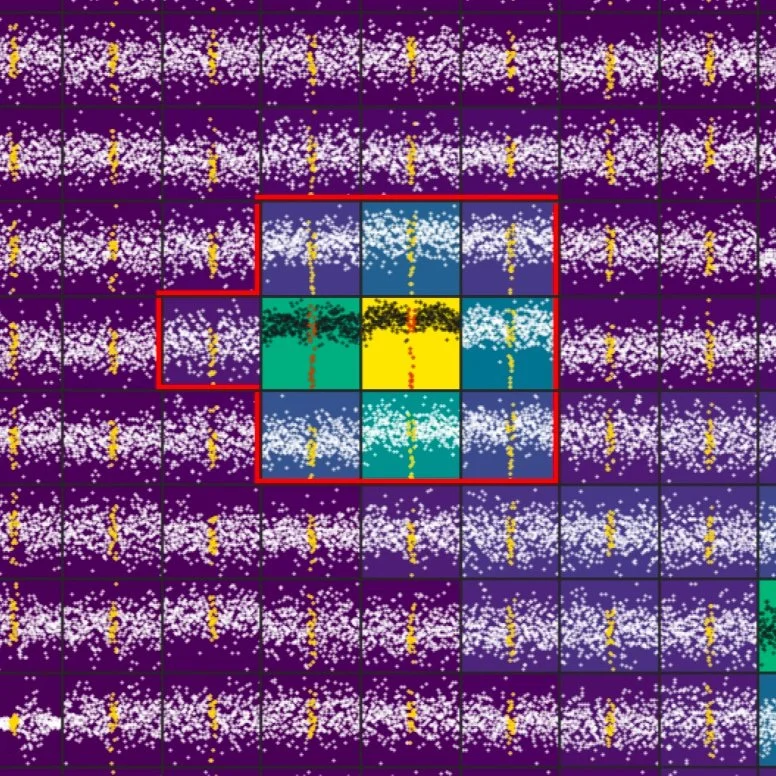
The signal is on target by investigating the light curve extracted for each pixel surrounding the target in order to ensure that the transit events are not caused by spurious background signals on other pixels.
There are no spurious signals, such as sudden jumps or strong variations, in the background flux at the same time as the event.
The transit shapes and depths when extracted with different aperture sizes are consistent.
The signal is on target by comparing the average in-transit and average out-of-transit flux, as well as the difference between them, which indicates the location of the change in flux (i.e., the location of the transit event).
Some of the libraries that this code makes use of are: pandas, NumPy, Matplotlib, and Lighkurve, astroquery, astropy and bokeh.
Find out more about the software from the publication, GitHub, or PyPI. Check out the online tool at http://latte-online.flatironinstitute.org/app
Example LATTE diagnostic plots
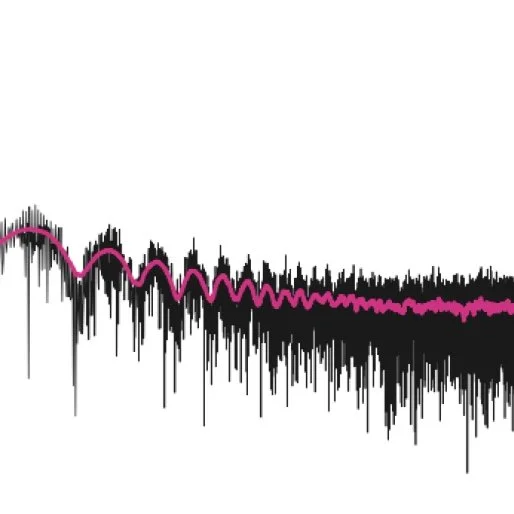
Fourier transform of the data to reveal periodic trends.
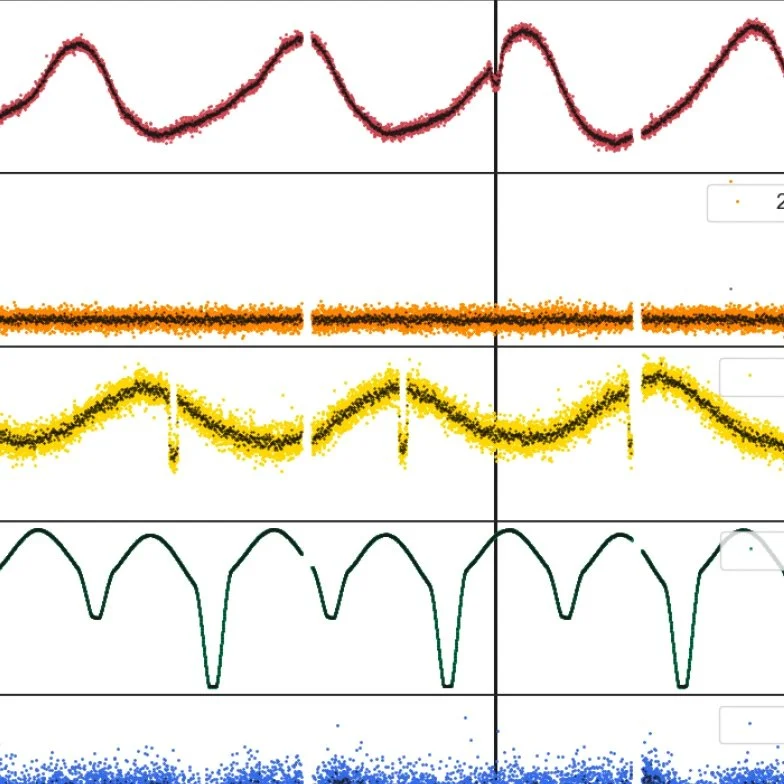
Time-series data of nearby stars. These stars reveal their own variability and stellar signatures.
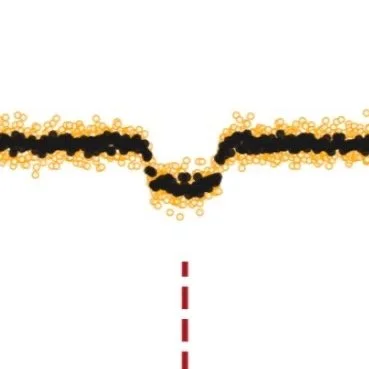
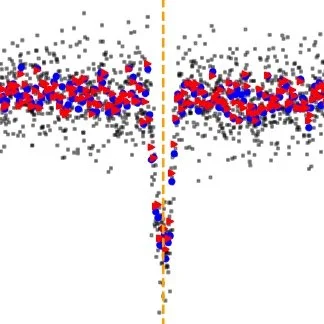
Signature of a planet passing in front of a star (transit event).
Time-series data extracted for each pixel surrounding the target.
Revealing origin of the signal. The target star is circles in orange. The signal is coming from the yellow pixel.
The time-series data extracted using two different aperture sizes.
